
UK HadCRUT, US NASA GISS, US NCDC, AustraliaMet ALL Altered Their Temperature Data Records to Make Warming – See Graphs Here
Written by Paul Litely at Paullitely.com
These tweets link to a site that clearly shows with
GRAPHS OF THE CHANGES MADE
how temperature records were and are manipulated all over the world. The early half of the 1900’s were made to look colder while the last half of the 1900’s are made to look warmer, right into the 2000’s. Peaks of warming in the past were clipped off. Troughs of cooling were also clipped off, all to create a warming trend, to suppress the effects of ocean El Ninos and La Mina’s, and to enable new “Record” High temperatures today. So now we can see how claims are made today that new record warm temperatures are happening…. when they are not. We can also see how the long straight handle of the “Hockeystick” IPCC graphs are made from past S curves. Their models cannot even predict the PAST. Who can you trust if they change the actual Raw measurements in an obvious slant to match their story?
Click on the links below to see how nearly all “Authorities” on temperature records have tilted or clipped their records to make warming that does not exist. Their patterns are obviously self-serving.
One justification given for making “Homogenizing” adjustments is because some thermometers used started out in open areas, but paving and buildings were added nearby. They call this the “heat island” effect, because replacing soil and greenery with Manmade structures adds heat. However, this would only justify LOWERING recent measurements to compensate. What we observe is lowering earlier measurements and raising recent measurements. That is opposite of the “Heat Island”effect, so is plainly arbitrary change to support their Global Warming agenda. Notably, there has been such scrutiny of recent measurements that this “Fudging” no longer can be done.
For current articles with more proof of misrepresentations of the raw measurements, go to my Twitter @paullitely to see more. A common technique today is to omit measurements of temperature and Ice and sea level, etc for the most recent years after 2012. Recent years trends have shown dramatic cooling Temperatures, and return of arctic ice to even above average. Severe warm weather weather event tornados and hurricanes have become much less common. This does not support the Global Warming agenda, so recent measurements are being delayed publication as long as possible.
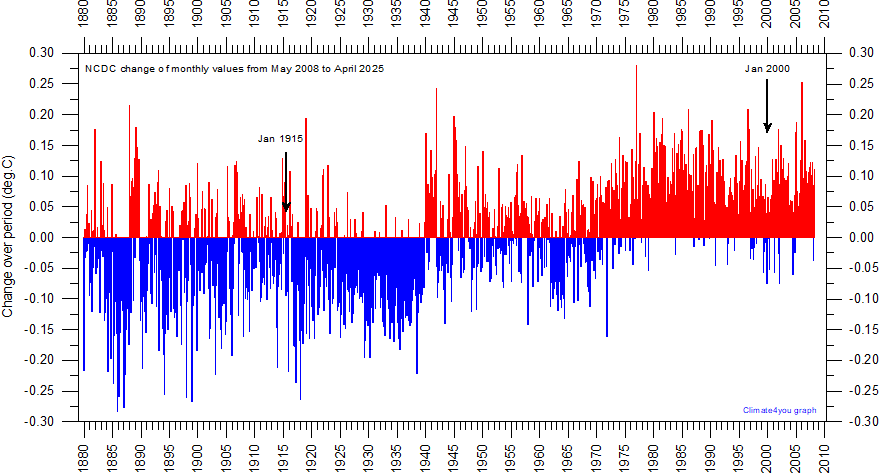
Twitter @paullitely: < US NCDC May2008-Sep2014 temperature records altered showing more #CO2 #globalwarming #climatechange
GRAPH OF CHANGES MADE http://www.climate4you.com/images/NCDC%20MaturityDiagramSince20080517.gif
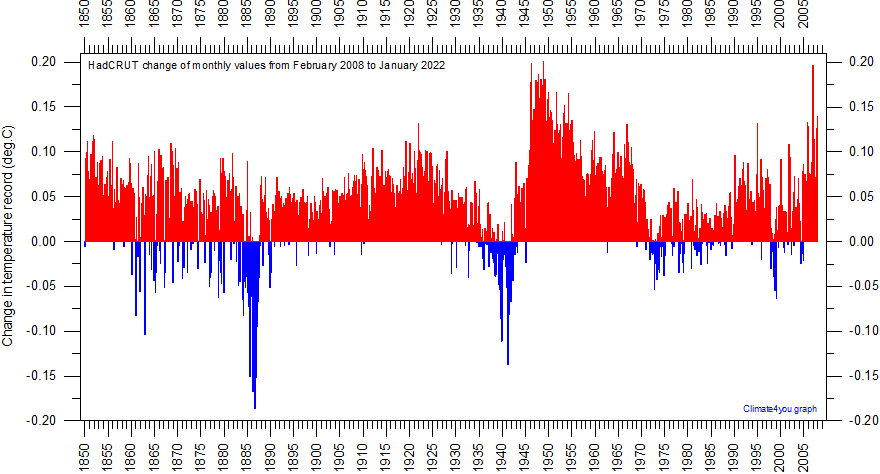
Twitter @paullitely: http://www.climate4you.com/images/HadCRUT3+4%20MaturityDiagramSince20080225.gif EastAnglia HadCRUT FEB2008-AUG2014 #temperaturedata record altered showing more #CO2 #globalwarming #climatechange
GRAPH OF CHANGES MADE
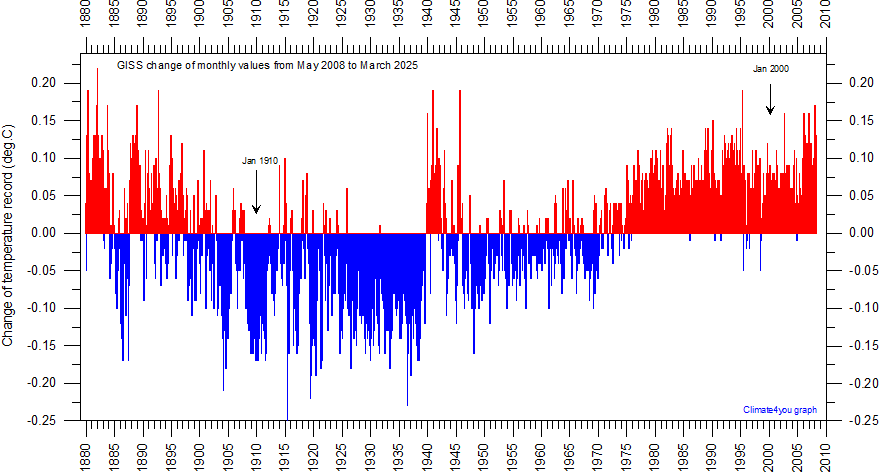
Twitter @paullitely: http://www.climate4you.com/images/GISS%20MaturityDiagramSince20080517.gif NASA GoddardInSpaceStudies May2008-Sep2014 alters temperature record showing more #CO2 #globalwarming #climatechange
GRAPH OF CHANGES MADE
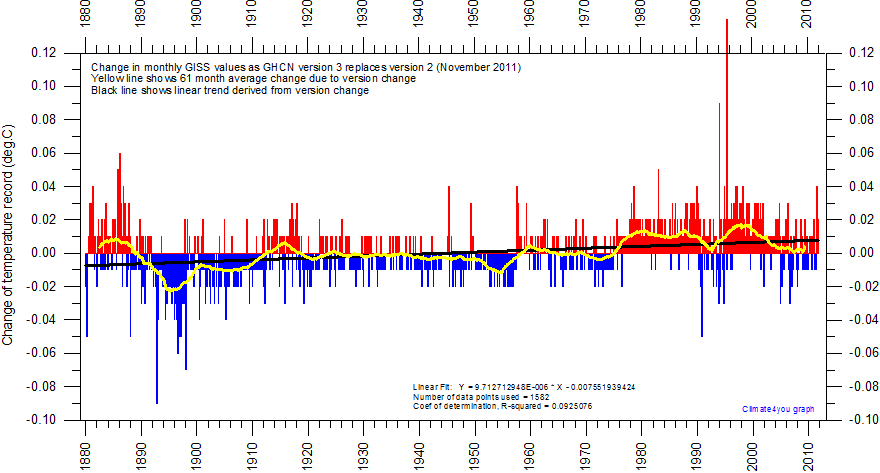
Twitter @paullitely: http://www.climate4you.com/images/GISS%20ChangeVersion3minus2.gif NASA GoddardInstituteSpaceStudies Nov2011 altered temperature record showing more #CO2 #globalwarming #climatechange
GRAPH OF CHANGES MADE
NASA GISS ARTICLE: http://notrickszone.com/2012/03/01/data-tamperin-giss-caught-red-handed-manipulaing-data-to-produce-arctic-climate-history-revision/
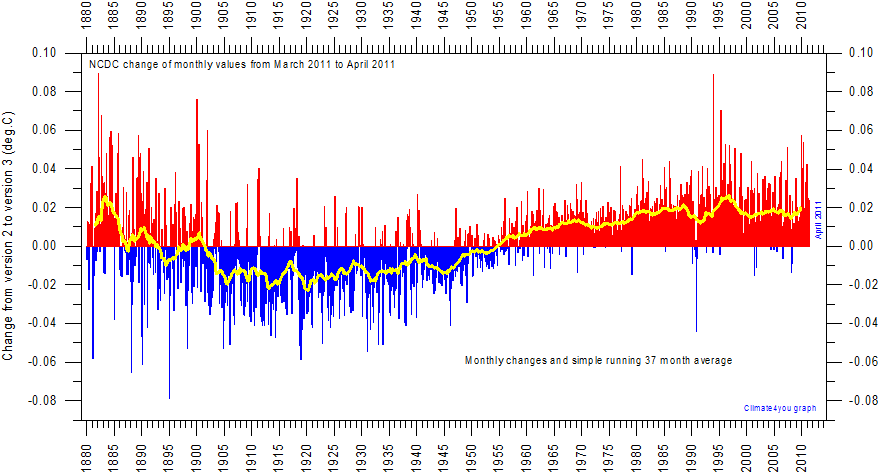
Twitter @paullitely: http://www.climate4you.com/images/NCDC%20ChangeVersion2-3Diagram201104-201105.gif US NCDC April 2011 altered temperature records showing more #CO2 #globalwarming #climatechange
GRAPH OF CHANGES MADE
Twitter @paullitely: #Australia “Scientists” Caught Red-Handed making up #CO2 #globalwarming trends http://news.heartland.org/newspaper-article/2014/09/19/australian-meteorologists-caught-fudging-numbers
Twitter @paullitely: #Australia again way out front -now- on #deadly #globalcooling Don’t trust Bureau of Meteorology, says Abbott govt http://reneweconomy.com.au/2014/dont-trust-bureau-of-meteorology-says-abbotts-business-advisor-54948

Reblogged this on paullitely and commented:
Raw temperature series are adjusted to Make Warming instead of to reduce them to compensate for heat island effects.
LikeLike