A bit on the long side, but stunning to say the least. Energy physicist Mike Brakey tells us why he is not surprised the NOAA might be investigated by Congress. (Sticky post).
=============================
The “Trick” to Controlling the Climate Agenda
By Mike Brakey
 Last April, in a short, narrated YouTube series titled, Black Swan Climate Theory [1] (BSCT) irrefutable evidence was presented that sometime between 2011 and 2015 the National Oceanic and Atmospheric Administration (NOAA) had on two occasions rewritten its own version of Maine’s statewide climate history. The gist of my findings was that I believe I caught NOAA purposefully using computer code (algorithms [2]) to lower historic temperatures to promote present day temperatures as the warmest on record. The image above is from the new YouTube series posted after NOAA’s acknowledgement that they had indeed made improvements to Maine’s climate history.
On May 6, 2015, NOAA confirmed in writing that the 151°F of Fudging—the Massive Rewrite of Maine Climate History, [3 ] reported in Black Swan Climate Theory [4] (BSCT) study was no accident. NOAA states the changes were intentional and were justified! NOAA’s written statement included these words [5]:
…improvements in the dataset, and brings our value much more in line with what was observed at the time. The new method used stations in neighboring Canada to inform estimates for data-sparse areas within Maine (a great improvement).”
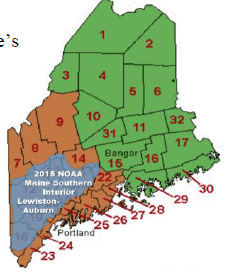 NOAA’s statement about the need to recently introduce colder Canadian data into Maine’s past climate history was highly fishy, to say the least. I decided to rework the research parameters to eliminate possible Canadian temperature infusion and confusion. Rather than compare my archived data for Lewiston/Auburn, Maine (Zone 19) to NOAA’s “statewide” [6] data for 32 Zones as I did in BSCT, I limited my analysis to NOAA’s southern interior data (CD 2) [7]. Since Lewiston/Auburn is centered in NOAA’s Maine southern interior climate region (see blue region of state chart), the two sets of numbers should essentially be identical. However, as I theorize, my findings again suggest NOAA is using a computer algorithm to inflate heating degree-days with all the raw climate data processed by an average of more than 10 percent.
This new approach is documented on our new narrated PowerPoint series, Black Swan Climate Theory II [8] (BSCTII). It will be posted on YouTube by early June 2015. Here are some of the highlights of our findings.
Incredible discrepancy
There remained an incredible discrepancy of Heating Degree Days (HDD) between the two southern interior Maine data sets.

The green-shaded area of the above chart to the right represents NOAA’s HDD values for the southern interior region of Maine, which I downloaded in May 2015. The black bars represent the raw HDD data that I gathered for Lewiston/Auburn over the last 10 years. I observed negligible difference between NOAA’s data for southern interior Maine and for the entire state of Maine. The annual average HDD’s for 1895 to 2014 were:
* 7,565 based on the raw data for Lewiston/Auburn;
* 8,276 based on NOAA’s 2015 data for the entire state of Maine; and
* 8,381 based on NOAA’s 2015 data for the southern interior region of Maine (105 HDD colder than statewide! See NOAA table below).

Flawed NOAA algorithms
I expected the HDD’s for the state’s entire 32 zones to be greater than for Lewiston/Auburn’s Zone 19 because the statewide NOAA data includes the vast colder regions in the northern part of the state. However, NOAA’s published 2015 data indicates the southern interior region of Maine runs 0.288°F colder on average over the last 119 years! This points out another of many flaws in the NOAA data when an agency begins relying on computer algorithms over basic clean data from Mother Nature.
As I lay out my case in BSCTII, I contend that NOAA adjusted the data for all of Maine and for the southern interior region using the same algorithm shown in the first chart. NOAA’s HDD adjustments were kept small in the most recent decade then grew substantially in earlier decades of the 19th and 20th centuries.

The chart above is drawn from BSCTII, Part 3 of 6, YouTube presentation [9]. In the presentation, step-by-step, I compared the raw data for Lewiston/Auburn to NOAA’s data for the state of Maine. I was able to discern the two algorithms that I believe NOAA implemented in 2011 and in 2014. Mother Nature’s data is the solid black line in the chart. Deviations from Mother Nature is shown as the blue line (percentage adjustment detected in 2013 archived data); the red line shows the percentage adjustment made in 2014 (detected in 2015). The green line is the master algorithm, the net effect of the two adjustments (blue and red lines).
I speculate that NOAA intended to quietly rewrite climate history over two programming runs (2011 and 2014). Each would lower historical temperatures a total of approximately 130°F.
I speculate that computer programming errors were discovered internally by NOAA after the 2011 algorithm was launched. NOAA decreased the 1913 HDD by 10% as opposed to increasing it by that amount. NOAA made 1913 one of the hottest years in Maine’s history. They eventually corrected that error and others with their 2014 algorithm run. I was not the first to catch this major faux pas.
Joseph D’Aleo, did a paper in 2014, involving Farmington, Maine data in southern interior Zone 13. The title of his effort was “Data Set Changes Makes It Hard to Tell Real Story” [10]. He complained of a 5°F swing in 1913 for NOAA’s southern interior data. In my April study, I had detected a 4°F swing for 1913 based on statewide archived NOAA data.
Maine’s history made a total of 254°F cooler
The 2011 algorithm lowered Maine “statewide” temperatures around 103°F. The Phase II algorithm run in 2014 corrected the 1913 error and lowered overall temperatures an additional 151°F. I contend that the master algorithm is now fully operational and maintains that Maine’s statewide climate history is over 254°F lower than the original documented records between 1895 and 2014!
As detailed in BSCTII, I contend that NOAA has attempted to maintain a number of the climate “inflection points” for authenticity while minimizing or completely eliminating all but one cooling period between 1895 and 2014. Drawn from BSCTII, Part 5 of 6, YouTube presentation [11] the following chart shows originally three Black Swan events [12] found with the Lewiston-Auburn data (the black line) provided by Mother Nature.

Three have been reduced to a single Black Swan event on the NOAA data (the green line) from 2014 for the southern interior region of Maine. Based on this and many other revelations found in BSCTII, I concluded that NOAA’s explanation of the inclusion of Canadian data was not only fishy—it proved to be a red herring [13].
“NOAA continues to manipulate historic climate data”
Based on these findings, my ongoing working theory is that NOAA continues to manipulate historic climate data through single master computer algorithm. The master algorithm array serves as the “trick” to hide present and future Black Swan [14] regional cooling events in Maine. I have also found that identical tweaks were being made with the other individual states and United State as a whole. It is being done by consistently lowering historical temperatures on all processed climate data controlled by NOAA as will be illustrated below with archived data from 2013.

Algorithm applied nationwide…2014 a fabricated record
The graphs above illustrate how I contend NOAA applied a master algorithm “trick” not only to Maine, but to the United States as a whole. The green graphs show NOAA’s HDD published in 2013 for Maine and the U.S. The blue graphs show NOAA’s HDD published in 2015 for the same two locations. As you can see, the HDD have been inflated in both cases by the same percentages. In 2014, it appears NOAA had completed cooling both Maine and U.S. climate history by increasing HDD over 5%. This permitted NOAA to lower historical temperatures in excess of 10% between 1895 and 2014. Now NOAA and government agencies could announce to the world that 2014 was one of the warmest years in U.S. (revised) history.
Ohio adjusted as well
Another example includes NOAA’s data associated with Ohio. The green graph below shows NOAA’s data for Ohio prior to its 2014 adjustment (but after the 2011 adjustment).

The blue shows the data after that adjustment. This second adjustment reduced Ohio’s historical temperatures by 83.8°F. You can see that it is the same pattern of adjustment as in Maine and the United States as a whole. I wonder if they needed Canadian meter stations here also!
NOAA’s data associated with Tennessee increased 18,802 HDD between 2013 and 2014. This reduced Tennessee’s historical temperature record an additional 51.5°F.
What is NOAA’s rational for the major correction here? The pattern is the same.
Based on my research to date, I have concluded that:
Whosoever holds the algorithm for interpreting and documenting past climate history possess the power to shape a nation’s perception of present climate and the funding solutions. Are we experiencing global warming or global cooling? It depends on whose historical climate data we are examining!
NOAA admitted to rewriting temperature
I want to emphasize again that NOAA admitted to massive rewrites of Maine “statewide” history on May 6, 2015. NOAA indicated all these changes to include Canadian stations were necessary to make sure the data truly reflected Maine history over the last 120 years.
How do they explain similar adjustments to Maine’s southern interior region, Tennessee, Ohio and the United States as a whole?
Every U.S. state for which I kept archived NOAA data had been corrupted in an identical manner. At this point in time, my theory that NOAA is rewriting U.S. climate history with a computer algorithm appears to still be valid.
Summary
I contend that the NOAA computer program essentially uses a very simple algorithm array, that automatically takes each historical year of local data and “shapes it” to fit into an overall mosaic NOAA wants to project to the scientific community and the general public.

The table below lists “Year”, “NOAA Master Algorithm Adjustment”, and the “Anti-Master Algorithm”.

The Anti-Master algorithm is nothing more than the reciprocal of NOAA’s algorithm.
This entire affair seems reminiscent of the early 1990s. The following chart below shows the multiple warming and cooling (Black Swan) periods over the last 1,100 years.

In 1990, the United Nation’s Intergovernmental Panel on Climate Change (IPCC) published the graph seen in Chart 1. It showed that the Middle Ages were warmer than today, in what was called the “Medieval Warming Period”. Then, around the 14th century, society begins its descent into a series of “Black Swan” cooling climate events. We plunged into the “Little Ice Age” period from which we gradually emerged in the early 1700s. There were at least five major Black Swan events over this time period.
In the late 1990s Michael Mann published Chart 2 which redefined climate history and eliminated numerous Black Swan events. A Congressional investigation uncovered numerous errors in Mann’s chart and the IPCC dropped it from the Summary of Policymakers for its 2007 report. Unfortunately, the false hockey stick is still cited by advocates of the “science-is settled” position [15]. This includes powerful members of NOAA and the current U.S. administration.
Are we now remaking American climate history to adhere to Mann’s disappearing hockey stick? I have theorized that NOAA has possibly attempted a similar approach for inconvenient climate history in Maine and across the United States.
The following chart shows the result of applying NOAA’s algorithm to the Lewiston-Auburn, Maine data (the black line). The result is NOAA’s green line.

In the transformation you eliminate two of the three Black Swans. This chart thereafter falls in line with Michael Mann’s chart from the late 1990’s that cited only one Black Swan event in the last hundred years.
My theory is that, if you begin with NOAA’s “adjusted” data and apply the anti-algorithm, you return the “processed data” back to how Mother Nature provided us the information in the first place.
USA likely in a state of cooling since 1990s
As a last example, on the chart below, we will take NOAA’s “processed” data for the United States climate history and apply the “anti-algorithm array” (see table above).

The application of the anti-algorithm would indicate the United States, as a whole, might have been in a state of regional cooling since the late 1990s, as is presently true of Maine when you use Mother Nature’s original data.
“…certain individuals in NOAA have being hoisting a fraud on taxpayers”
If my theory is proven correct, it would mean certain individuals in NOAA have being hoisting a fraud on taxpayers of the U.S. and around the world. It has added up to trillions of dollars over the decade. [16]
As noted in BSCT and BSCTII, I play a short video clip of Doctor Feynman explaining how theories are generated and how they should be tested repeatedly.

We expect no less here. I welcome a thorough examination of my algorithm theory.
In Black Swan Climate Theory II we explain, in depth, why, in my opinion, I believe this is not an accident. I have concluded American basic climate data has been hijacked and corrupted within NOAA through the use of a simple master computer algorithm that I have repeated here.
 Profound implications
Based on the evidence from Maine, Ohio, Tennessee and consolidated U.S. climate data presented in the BSCT series; and should my theory be validated, the implications are profound. It would indicate we presently live in a nation where an agency of the Federal government has taken it upon themselves to rewrite the history of climate for the fifty different individual states of the Union.
If my theory proves correct, billions of dollars of climate data has been corrupted within a formerly great organization. Worse, decisions worth trillions of dollars are being made presently on fraudulent climate data. As well-intended as I believe most NOAA associates are, I implore NOAA to please make available the plain, unexciting, unfiltered temperature data provided by Mother Nature.
Throw the environmental activists [17] out! The litmus test for me is when NOAA’s climate data agrees with both satellite data and local archived data.
References:
[1] Black Swan Climate Theory, April, 2015, Mike Brakey, 1st series of five (5) short YouTube videos on NOAA climate adjustments https://www.youtube.com/playlist?list=PLDXMwo2SyaRse3GWujVHJGTLl9nvGAD59
[2] A computer program can be viewed as an elaborate algorithm. In mathematics and computer science, an algorithm usually means a small procedure that solves a recurrent problem. I contend NOAA has been attempting to correct a climate aberration that Mother Nature has repeatedly thrown at the organization since 1998. These inconvenient aberrations are pockets of regional cooling in Maine, across the United States and likely around the world between 1998 and 2010!
[3] 151 Degrees of Fudging, May 2, 2015, Mike Brakey, Link: http://notrickszone.com/2015/05/02/151-degrees-of-fudging-energy-physicist-unveils-noaas-massive-rewrite-of-maine-climate-history/#sthash.9QtBzze0.SF5o7vzD.dpbs
[4] Black Swan Climate Theory, April, 2015, Mike Brakey, series of five (5) short YouTube videos on recently discovered NOAA climate adjustments that rewrote Maine climate history – https://www.youtube.com/playlist?list=PLDXMwo2SyaRse3GWujVHJGTLl9nvGAD59
[5] NOAA E-Mail Confirms Large Scale Rewrite of U.S. Temperature Data, May 6, 2015, Mr. Derek Arndt, NOAA, Link: http://notrickszone.com/2015/05/07/noaa-e-mail-confirms-large-scale-rewrite-of-u-s-temperature-data-in-2014-improvements-in-the-dataset/#sthash.T6Bpcr1O.4fwNcmBn.dpbs
[6] NOAA classifies Maine heating degree days under four divisions. They are Statewide CD 1 North CD 2 South Interior, and CD 3 Coastal.
[7] Unlike “statewide” and “CD 1 North” this region, “CD 2 South Interior” should have no reason to be subject to Canadian temperature contamination.
[8] Black Swan Climate Theory II, Michael Brakey, June, 2015. The six part PowerPoint YouTube series is also found at the following link: https://www.youtube.com/playlist?list=PLDXMwo2SyaRse3GWujVHJGTLl9nvGAD59. The presentation takes you step-by-step through how it appears that leadership in NOAA unashamedly created a new master algorithm that was applied to the Maine data to rewrite climate history.
[9] See link: https://www.youtube.com/watch?v=Pn3QUEE3HYo&index=8&list=PLDXMwo2SyaRse3GWujVHJGTLl9nvGAD59
[10] https://redneckusa.files.wordpress.com/2014/07/data-set-changes-makes-it-hard-to-tell-real-story.pdf
[11] See Link: https://www.youtube.com/watch?v=go1zpvUzmRk&list=PLDXMwo2SyaRse3GWujVHJGTLl9nvGAD59&index=10
[12] A Black Swan event is a significant cooling period of more than ten years.
[13] red herring is something that misleads or distracts from a relevant or important issue. It may be either a logical fallacy or a literary device that leads readers or audiences towards a false conclusion.
[14] or theory of black swan events is a metaphor that describes an event that comes as a surprise, has a major effect, and is often inappropriately rationalized after the fact with the benefit of hindsight.
[15] The Deniers, Lawrence Solomon, 2008, Richard Vigilante Books, Chapter 2, The Case of the Disappearing Hockey Stick. pp. 9-21.
[16] The Alarming Cost Of Climate Change Hysteria, Larry Bell, Forbes, August, 2011; See link: http://www.forbes.com/sites/larrybell/2011/08/23/the-alarming-cost-of-climate-change-hysteria/
[17] Robber Barons disparaging term dating back to the 12th century which refers to: 1. Unscrupulous feudal lords who amassed personal fortunes by using illegal and immoral business practices. 2. In social criticism and economic literature, became a derogatory term applied to some wealthy and powerful 19th-century American businessmen. Does it now apply to the leaders of the environmental movement?


