Tag Archives: Whitewash

We are Now Tipping into a “Landsheidt Minimum” Mini Iceage. Earth Climate Predictions Using NASA Solar Sunspot Tracking, and Works by the late Theodor Landsheidt, and the Late Carl Smith with Geoff Sharp Contributions

Also be sure to read this other post for a comprehensive explanation of how the Earth’s Past and Present Global Temperatures Clearly Follow Known Patterns. DON’T MISS IT for a full understanding of the proven science.

How in the Universe do you connect Weather to Human Caused CO2? Here is How Earth Atmosphere Works, Including Ice Ages

“How in the Universe to you Connect Global Warming to Human Caused CO2?”

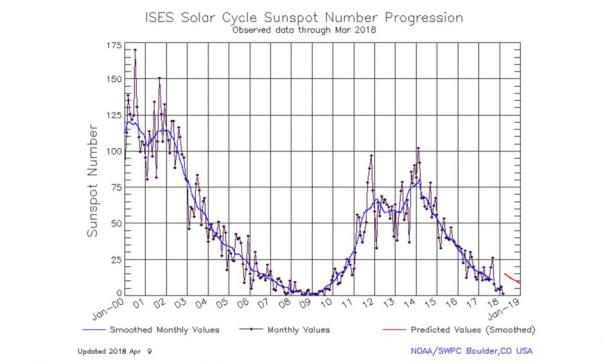
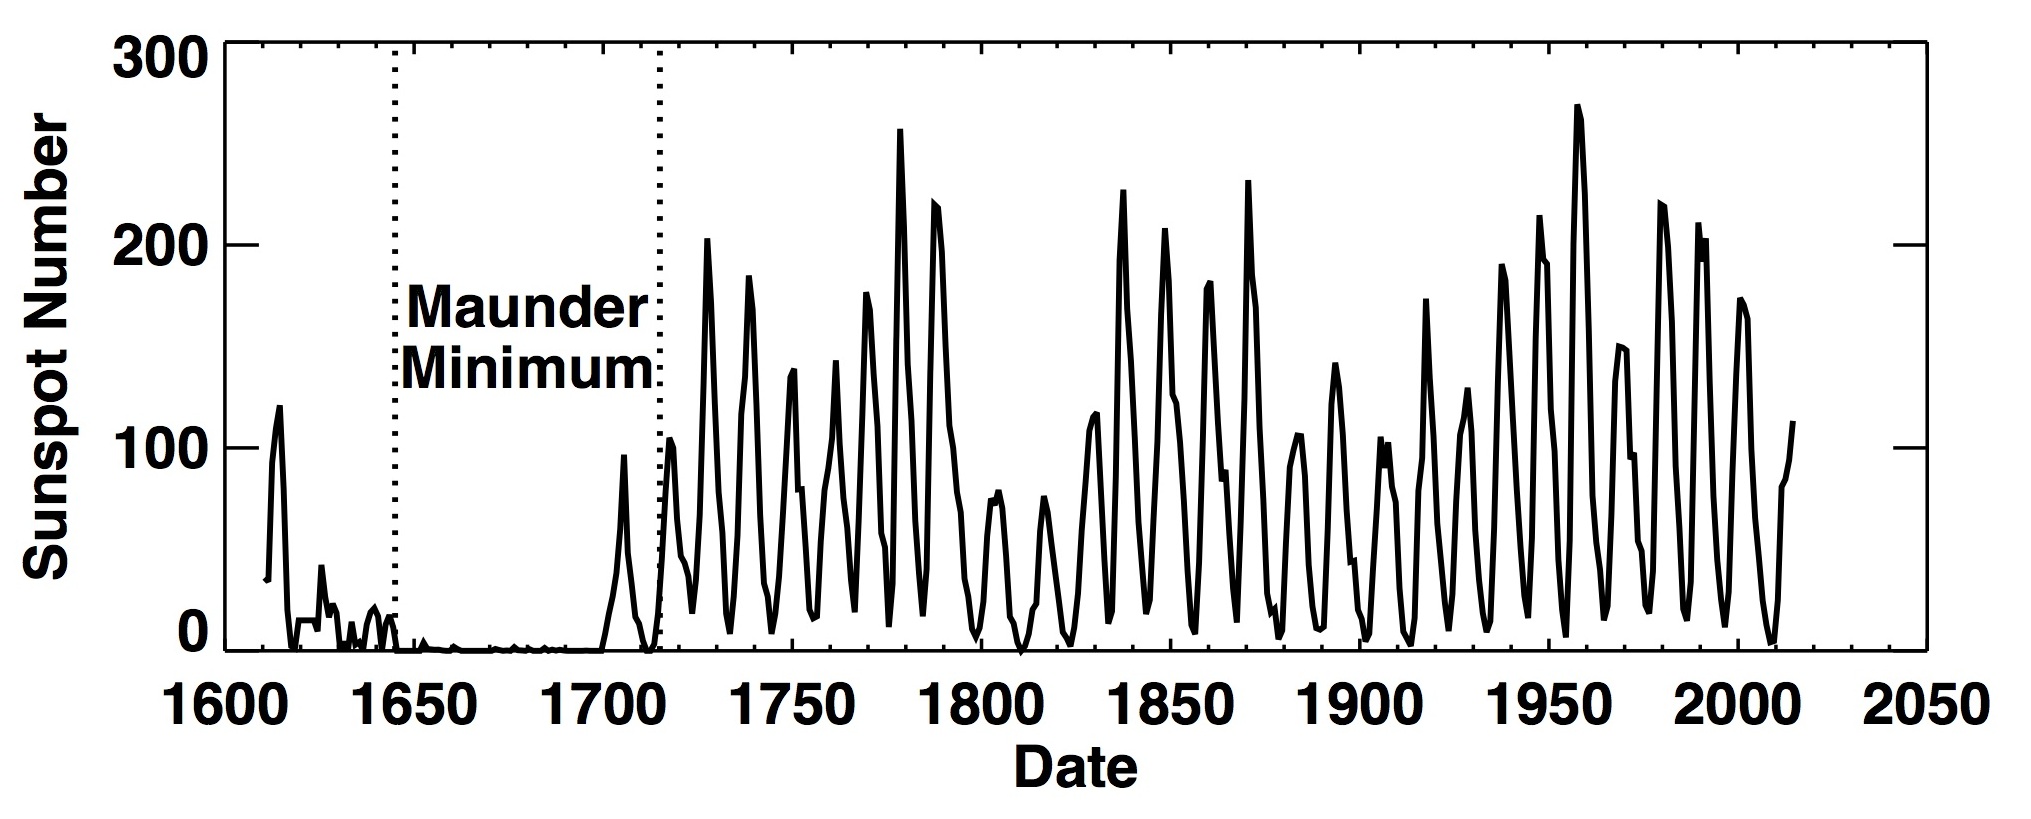
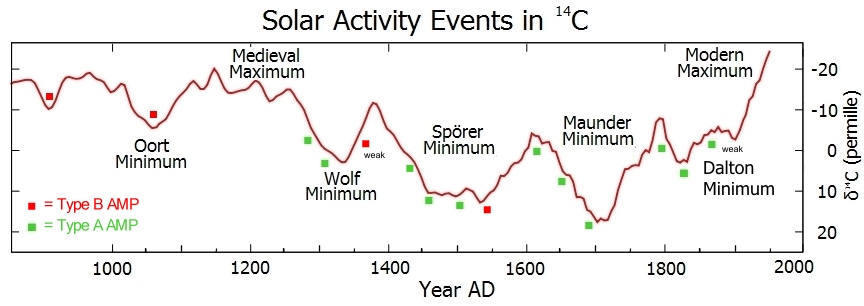
We are quickly entering a period of deadly cold on Planet Earth.  NASA’s own Sunspot Tracking page makes specific note of the similarity between today’s declining Sunspot activity and a similar event the lasted from the year 1645 to the year 1715 called the “Maunder Minimum”.  This period in history is known for cold weather that made growing food difficult or impossible in Europe and North America. Disease and Famine and resulting Wars racked the planet.  Theodor Landscheidt was first to correlate these times with Solar Sunspot activity and El Nino/La Nina events to accurately predict temperatures in the Northern Half of the Earth.  Carl Smith and Geoff Sharp found the influence of the large planets Jupiter, Saturn, Neptune, and Uranus on the Sun.  The gravity of these huge planets tug on the sun, influencing the Sunspot cycles. The Solar activity cycles control the Cosmic Rays that govern cloud cover on Earth.  Henrik Svensmark demonstrated the clear Corrolation that increased Cosmic Rays increase Cloud Formation. Cloud formation releases vast amounts of Warm Water Vapor heat into space, and the tops of clouds reflect 90% of the Sun’s Heating Radiation.   Water Vapor is 95% of the Earth’s Greenhouse Gasses.  Together, Landscheidt, and Smith, Sharp and Svensmark predict we are entering into a mini ice age similar to the Maunder Minimum, that could last 30 years or more.

Direct Evidence for this cooling has been provided by Calibrated Satellite temperature measurements of the entire Earth, something that NASA’s thermometers on the surface cannot do.  These satellite temperature measurements show a slight cooling that began in 2003, not the warming that NASA/NOAA claims from surface thermometers they adjust to make warming appear.  If the Landscheidt predictions are correct, we are tipping into a period of deadly cooling, not uncomfortable warming as predicted by the IPCC International Panel on Climate Change at the United Nations.  The IPCC are not scientists.  They are Politicians who pay scientists.  They are getting what they pay for.  They are getting more predictions of Global Warming, when it is not warming.

As the real trend of cooling continues, we will need all the energy sources we can find to compensate, including renewables and non-renewables. Politics and science have teamed up in the past to predict future cold and warm periods. They have always been wrong because the scientific mechanism was not fully understood.  This includes the current “Global Warming” or “Climate Change” predictions.  Look back at them and see how many of their predictions have come true.  NONE of them have come true.  Decide then for yourself who to believe.

Now we finally have a scientific explanation for these warm and cool periods, and it does not seem to follow the amount of CO2 in the atmosphere.  Instead, CO2 FOLLOWS the temperature changes with a delay of hundreds of years.  Today’s Global Warming theory has them backwards. Al Gore conveniently shifted the long term graphs to make it look the other way.  Check it.  The only time in recent history when warming followed CO2 was a coincidence from 1974 to 2003.  That was very convenient for Al Gore, a politician, not a scientist.  Before that (1950s and 1960s), and after that (2004 to now), temperatures went down while CO2 went up. NASA/NOAA PUBLISHED Thermometer Records are wrong from 2003 to now, they are too hot.   NASA/NOAA adjusted their RECENT measured temperatures upward, and adjusted their own previously published PAST measured temperatures downward, showing a warming trend. They did this, by adjusting their own raw surface measurements that were already verified by the very close Satellite temperature measurements.  Why do they make these adjustments when their own raw data is confirmed by the satellites?  Ask them, that is what they get paid for. NASA/NOAA also went back in time to adjust the past Thermometer records to make the past cooler than today.  Therefore, they continue to make claims of “The Hottest Year” each year.  There are other posts here on this site from other sources that clearly show this is true, including a simple presentation to Vladimir Putin from his scientists in 2004 making it very clear.  It also makes it very clear that the cost of trying to change the weather is infinite if you choose CO2 as the control knob.  It does not work.

This disconnect between CO2 and Global Temperatures was clearly and in detail understood as far back as the original Kyoto Protocol meeting on Climate Change in 1992, but its conclusions were against the grain of the popular Global Warming Theory then and now. The potential economic damage of pursuing CO2 reduction was also clearly understood. Here is a link to the Putin presentation that was prepared for him, not for public presentation.  It was shown there once, but not well attended. Be sure to see the second half, where graphic proof of the science shows CO2 does not track with temperatures, and the Global Warming theory is flawed.

http://iccfglobal.org/ppt/Illarionov-013004.html.ppt

How Putin knew in 1992 that Global Warming Theory is Flawed

The sunspots are directly correlated with temperature cycles on the Earth.  NASA themselves observed that this is true in the quote below.  The mechanism is not that the sun gets brighter or dimmer, but instead, the active sun blocks cosmic rays that make clouds.

http://www.thehindu.com/todays-paper/tp-national/article1107174.ece

NASA says the Sun controls Earth Clinate

The sun is in a declining cycle of activity right now, predicted by Landscheidt, Smith, and Sharp.  This means Cosmic rays are free to increase cloud cover on the Earth.  To see how all of this works, see another post on this site at:

How in the Universe do you connect Weather to Human Caused CO2? Here is How Earth Atmosphere Works, Including Ice Ages

How in the Universe can CO2 control Climate?

We are being prepared for the opposite temperature trend than is truly happening for political and financial gain.  We will know for sure in the next few years, but the signs are already here.  Polar Ice caps are back to normal and growing.  Greenland is not melting. The Northwest Passage is closed.  Record Cold weather events are at least as frequent than Record Warm weather events.

NASA wrote: “Early records of sunspots indicate that the Sun went through a period of inactivity in the late 17th century. Very few sunspots were seen on the Sun from about 1645 to 1715 (38 kb JPEG image). Although the observations were not as extensive as in later years, the Sun was in fact well observed during this time and this lack of sunspots is well documented. This period of solar inactivity also corresponds to a climatic period called the “Little Ice Age” when rivers that are normally ice-free froze and snow fields remained year-round at lower altitudes. There is evidence that the Sun has had similar periods of inactivity in the more distant past. The connection between solar activity and terrestrial climate is an area of on-going research.”

Here is a link to that NASA page:

http://solarscience.msfc.nasa.gov/SunspotCycle.shtml

The Quiet Sun and The Mini Iceage

NASA has since become attached to the Political Bandwagon of Global Warming supposedly caused by CO2, caused by Humans.  The science for this could not be more incorrect.  NASA abandoned their statement above, their understanding of the relationship between the sun’s activity and Earthly temperatures because they did not understand how it works.  They observed that the sun’s brightness only varies slightly, perhaps 3%.  Because of the attraction towards blaming Humans for “Climate Change”, they abandoned the clear relationship between sunspots and Earth’s Temperature.  Instead, they attached themselves to the unproven theory that CO2 causes temperature changes, and they have tried to explain how the tiny amount of CO2 contributed by humans (.03% of the CO2 in the atmosphere) can make the tiny amount of CO2 itself (3% of the atmosphere) change the weather.  It sounds very unlikely, doesn’t it? It is clearly a political position, not a scientific one.  What more likely explanation could there be for the Earth’s temperature cycles?  We must go back to NASA’s own statement above on the direct correlation between the Sunspot count and periods of deep cold or warmth on Earth.

A Meteorologist named Theodor Landscheidt (Died 2004) predicted today’s decline in Solar Activity back in 1989, and successfully predicted the weather trends that have accompanied it.  His forecast is for an imminent coming period of decades where Earth’s weather will be very cold, caused by events similar to what was seen in the “Maunder Minimum” of the 1600’s.  It is becoming more common to refer to today’s low Solar Activity period as the “Landscheidt Minimum”.  Per Landscheidt, Smith and Sharp, we are already tipping into a dramatic cooling period that will deepen rapidly, and be very obvious in the 2020’s or before.

Here is a lin of tk to a page with Theodor Landsheidt’s papers.  Note he successfully predicted recent El Nino and La Nina events.

Papers by Dr Theodor Landscheidt

Theodore Landscheidt Papers

Here is a link to a page by Geoff Sharp on the late Carl Smith’s research on the effects of the Planets tugging on the Sun. Carl’s observations, going back 6,000 years describe the empirical connection between the orbiting movement of the Planets and the Solar Activity as measured by Sunspots.

Building on Theodor Landsheidt’s work, Carl has demonstrated even greater accuracy than Landsheidt how the Sun’s activity may be explained and predicted.

Geoff Sharp has contributed, standing on the strong shoulders of Landsheidt and Smith to refine and demonstrate further the direct empirical relationship between planetary movement and the Sun’s activity, and the Earth’s climate.

http://www.landscheidt.info/

CARL Smith and Geoff Sharp refine Landscheidt theory

What does this mean regarding the Earth’s weather in the future?  If Theodor and Carl were right about the pattern of Solar activity we can expect in the near future, then Landscheidt’s prediction of a mini ice age in the first half of the 21st century will come true.  There will be predictable effects on the Earth’s weather, including El Nino and La Nina ocean events and Global temperatures.  We can expect dangerous, even deadly cooling in the next fifteen years with deeper cold and longer winters.  The end will depend upon how fast the Sun recovers from the influences of the larger planets.

Here is a link to a blog with discussions on this subject, giving credit to Theodor Landsheidt for his accurate predictions in the past.

http://www.armageddononline.org/forums/threads/27407-The-Clearest-evidence-to-date-the-Landsheidt-Minimum

The Landscheidt Mini Iceage is Here

SolarCycle_graphic March 2019

Nobel Prize-Winning Scientist Dr. Ivar Giever who endorsed Obama now Says President is ‘Ridiculous’ and ‘DeadWrong’ on Global Warming

Nobel Prize-Winning Scientist Who Endorsed Obama Now Says Prez. is ‘Ridiculous’ & ‘Dead Wrong’ on ‘Global Warming’
Nobel Prize Winning Physicist Dr. Ivar Giaever: ‘Global warming is a non-problem’

‘I say this to Obama: Excuse me, Mr. President, but you’re wrong. Dead wrong.’

‘Global warming really has become a new religion.’

“I am worried very much about the [UN] conference in Paris in November…I think that the people who are alarmist are in a very strong position.’

‘We have to stop wasting huge, I mean huge amounts of money on global warming.’
By: Marc Morano – Climate Depot July 6, 2015
Climate Depot Exclusive

Dr. Ivar Giaever, a Nobel Prize-Winner for physics in 1973, declared his dissent on man-made global warming claims at a Nobel forum on July 1, 2015.

“I would say that basically global warming is a non-problem,” Dr. Giaever announced during his speech titled “Global Warming Revisited.”

Image result for ivar giaever

Giaever, a former professor at the School of Engineering and School of Science Rensselaer Polytechnic Institute, received the 1973 physics Nobel for his work on quantum tunneling. Giaever delivered his remarks at the 65th Nobel Laureate Conference in Lindau, Germany, which drew 65 recipients of the prize. Giaever is also featured in the new documentary “Climate Hustle”, set for release in Fall 2015.

Giaever was one of President Obama’s key scientific supporters in 2008 when he joined over 70 Nobel Science Laureates in endorsing Obama in an October 29, 2008 open letter. Giaever signed his name to the letter which read in part: “The country urgently needs a visionary leader…We are convinced that Senator Barack Obama is such a leader, and we urge you to join us in supporting him.”

But seven years after signing the letter, Giaever now mocks President Obama for warning that “no challenge poses a greater threat to future generations than climate change”. Giaever called it a “ridiculous statement.”

“That is what he said. That is a ridiculous statement,” Giaever explained.

“I say this to Obama: Excuse me, Mr. President, but you’re wrong. Dead wrong,” Giaever said. (Watch Giaever’s full 30-minute July 1 speech here.)

“How can he say that? I think Obama is a clever person, but he gets bad advice. Global warming is all wet,” he added.

“Obama said last year that 2014 is hottest year ever. But it’s not true. It’s not the hottest,” Giaever noted. [Note: Other scientists have reversed themselves on climate change. See:

Politically Left Scientist Dissents – Calls President Obama ‘delusional’ on global warming

The Nobel physicist questioned the basis for rising carbon dioxide fears.

“When you have a theory and the theory does not agree with the experiment then you have to cut out the theory. You were wrong with the theory,” Giaever explained.
Global Warming ‘a new religion’

Giaever said his climate research was eye opening. “I was horrified by what I found” after researching the issue in 2012, he noted.

“Global warming really has become a new religion. Because you cannot discuss it. It’s not proper. It is like the Catholic Church.”

Concern Over ‘Successful’ UN Climate Treaty

“I am worried very much about the [UN] conference in Paris in November. I really worry about that. Because the [2009 UN] conference was in Copenhagen and that almost became a disaster but nothing got decided. But now I think that the people who are alarmist are in a very strong position,” Giaever said.

“The facts are that in the last 100 years we have measured the temperatures it has gone up .8 degrees and everything in the world has gotten better. So how can they say it’s going to get worse when we have the evidence? We live longer, better health, and better everything. But if it goes up another .8 degrees we are going to die I guess,” he noted.

“I would say that the global warming is basically a non-problem. Just leave it alone and it will take care of itself. It is almost very hard for me to understand why almost every government in Europe — except for Polish government — is worried about global warming. It must be politics.”

“So far we have left the world in better shape than when we arrived, and this will continue with one exception — we have to stop wasting huge, I mean huge amounts of money on global warming. We have to do that or that may take us backwards. People think that is sustainable but it is not sustainable.

On Global Temperatures & CO2

Giaever noted that global temperatures have halted for the past 18 plus years. [Editor’s Note: Climate Depot is honored that Giaever used an exclusive Climate Depot graph showing the RSS satellite data of an 18 year plus standstill in temperatures at 8:48 min. into video.]

The Great Pause lengthens again: Global temperature update: The Pause is now 18 years 3 months (219 months)

Giaever accused NASA and federal scientists of “fiddling” with temperatures.

“They can fiddle with the data. That is what NASA does.”

“You cannot believe the people — the alarmists — who say CO2 is a terrible thing. Its not true, its absolutely not true,” Giaever continued while showing a slide asking: ‘Do you believe CO2 is a major climate gas?’

“I think the temperature has been amazingly stable. What is the optimum temperature of the earth? Is that the temperature we have right now? That would be a miracle. No one has told me what the optimal temperature of the earth should be,” he said.

“How can you possibly measure the average temperature for the whole earth and come up with a fraction of a degree. I think the average temperature of earth is equal to the emperor’s new clothes. How can you think it can measure this to a fraction of a degree? It’s ridiculous,” he added.

Silencing Debate

Giaever accused Nature Magazine of “wanting to cash in on the [climate] fad.”

“My friends said I should not make fun of Nature because then they won’t publish my papers,” he explained.

“No one mentions how important CO2 is for plant growth. It’s a wonderful thing. Plants are really starving. They don’t talk about how good it is for agriculture that CO2 is increasing,” he added.

Extreme Weather claims

“The other thing that amazes me is that when you talk about climate change it is always going to be the worst. It’s got to be better someplace for heaven’s sake. It can’t always be to the worse,” he said.

“Then comes the clincher. If climate change does not scare people we can scare people talking about the extreme weather,” Giaever said.

“For the last hundred years, the ocean has risen 20 cm — but for the previous hundred years the ocean also has risen 20 cm and for the last 300 years, the ocean has also risen 20 cm per 100 years. So there is no unusual rise in sea level. And to be sure you understand that I will repeat it. There is no unusual rise in sea level,” Giaever said.

“If anything we have entered period of low hurricanes. These are the facts,” he continued.

“You don’t’ have to even be a scientist to look at these figures and you understand what it says,” he added.

“Same thing is for tornadoes. We are in a low period on in U.S.” (See:

Extreme weather failing to follow ‘global warming’ predictions: Hurricanes, Tornadoes, Droughts, Floods, Wildfires, all see no trend or declining trends

)

Media Hype

“What people say is not true. I spoke to a journalist with [German newspaper Die Welt yesterday…and I asked how many articles he published that says global warming is a good thing. He said I probably don’t publish them at all. Its always a negative. Always,” Giever said.

Energy Poverty

“They say refugees are trying to cross the Mediterranean. These people are not fleeing global warming, they are fleeing poverty,” he noted.

“If you want to help Africa, help them out of poverty, do not try to build solar cells and windmills,” he added.

“Are you wasting money on solar cells and windmills rather than helping people? These people have been misled. It costs money in the end to that. Windmills cost money.”

“Cheap energy is what made us so rich and now suddenly people don’t want it anymore.”

“People say oil companies are the big bad people. I don’t understand why they are worse than the windmill companies. General Electric makes windmills. They don’t tell you that they are not economical because they make money on it. But nobody protests GE, but they protest Exxon who makes oil,” he noted.

#

Dr. Ivar Giaever resigned as a Fellow from the American Physical Society (APS) on September 13, 2011 in disgust over the group’s promotion of man-made global warming fears.

In addition to Giaever, other prominent scientists have resigned from APS over its stance on man-made global warming. See: Prominent Physicist Hal Lewis Resigns from APS: ‘Climategate was a fraud on a scale I have never seen…Effect on APS position: None. None at all. This is not science’

Other prominent scientists are speaking up skeptically about man-made global warming claims. See:

Prominent Scientist Dissents: Renowned glaciologist declares global warming is ‘going to be a big plus’ – Fears ‘Frightening’ Cooling – Warns scientists are ‘prostituting their science’

Giaever has become a vocal dissenter from the alleged “consensus” regarding man-made climate fears. He was featured prominently in the 2009 U.S. Senate Report of (then) Over 700 Dissenting International Scientists from Man-made global warming. Giaever, who is a member of the National Academy of Sciences and won the 1973 Nobel Prize for Physics. (Watch news coverage here.)

Giaever was also one of more than 100 co-signers in a March 30, 2009 letter to President Obama that was critical of his stance on global warming. See: More than 100 scientists rebuke Obama as ‘simply incorrect’ on global warming: ‘We, the undersigned scientists, maintain that the case for alarm regarding climate change is grossly overstated’

Giaever is featured on page 89 of the 321 page of Climate Depot’s more than 1000 dissenting scientist report (updated from U.S. Senate Report). Dr. Giaever was quoted declaring himself a man-made global warming dissenter. “I am a skeptic…Global warming has become a new religion,” Giaever declared. “I am Norwegian, should I really worry about a little bit of warming? I am unfortunately becoming an old man. We have heard many similar warnings about the acid rain 30 years ago and the ozone hole 10 years ago or deforestation but the humanity is still around,” Giaever explained. “Global warming has become a new religion. We frequently hear about the number of scientists who support it. But the number is not important: only whether they are correct is important. We don’t really know what the actual effect on the global temperature is. There are better ways to spend the money,” he concluded.

Giaever also told the New York Times in 2010 that global warming “can’t be discussed — just like religion…there is NO unusual rise in the ocean level, so what where and what is the big problem?”

Related Links:

Exclusive: Nobel Prize-Winning Physicist Who Endorsed Obama Dissents! Resigns from American Physical Society Over Group’s Promotion of Man-Made Global Warming

– Nobel Laureate Dr. Ivar Giaever: ‘The temperature (of the Earth) has been amazingly stable, and both human health and happiness have definitely improved in this ‘warming’ period.’

Nobel Prize Winning Physicist Ivar Giaever: ‘Is climate change pseudoscience?…the answer is: absolutely’ — Derides global warming as a ‘religion’

2012: Nobel Prize Winning Physicist Ivar Giaever: ‘Is climate change pseudoscience?…the answer is: absolutely’ — Derides global warming as a ‘religion’

– ‘He derided the Nobel committees for awarding Al Gore and R.K. Pachauri a peace prize, and called agreement with the evidence of climate change a ‘religion’… the measurement of the global average temperature rise of 0.8 degrees over 150 years remarkably unlikely to be accurate, because of the difficulties with precision for such measurements—and small enough not to matter in any case: “What does it mean that the temperature has gone up 0.8 degrees? Probably nothing.”

When Science IS Fiction: Nobel Physics laureate Ivar Giaever has called global warming (aka. climate change) a ‘new religion’

-When scientists emulate spiritual prophets, they overstep all ethical bounds. In doing so, they forfeit our confidence’

American Physical Society Statement on Climate Change: No Longer ‘Incontrovertible,’ But Still Unacceptable

Skeptic win… American Physical Society removes ‘incontrovertible’ from climate change position

Politically Left Scientist Dissents – Calls President Obama ‘delusional’ on global warming

SPECIAL REPORT: More Than 1000 International Scientists Dissent Over Man-Made Global Warming Claims – Challenge UN IPCC & Gore

– Climate Depot Exclusive: 321-page ‘Consensus Buster’ Report

Another Prominent Scientist Dissents! Fmr. NASA Scientist Dr. Les Woodcock ‘Laughs’ at Global Warming – ‘Global warming is nonsense’ Top Prof. Declares

Green Guru James Lovelock on Climate Change: ‘I don’t think anybody really knows what’s happening. They just guess’ – Lovelock Reverses Himself on Global Warming

More Than 1000 International Scientists Dissent Over Man-Made Global Warming Claims – Challenge UN IPCC & Gore

Top Swedish Climate Scientist Says Warming Not Noticeable: ‘The warming we have had last a 100 years is so small that if we didn’t have climatologists to measure it we wouldn’t have noticed it at all’ – Award-Winning Dr. Lennart Bengtsson, formerly of UN IPCC: ‘We Are Creating Great Anxiety Without It Being Justified’

‘High Priestess of Global Warming’ No More! Former Warmist Climate Scientist Judith Curry Admits To Being ‘Duped Into Supporting IPCC’ – ‘If the IPCC is dogma, then count me in as a heretic’

German Meteorologist reverses belief in man-made global warming: Now calls idea that CO2 Can Regulate Climate ‘Sheer Absurdity’ — ‘Ten years ago I simply parroted what the IPCC told us’

UN Scientists Who Have Turned on the UN IPCC & Man-Made Climate Fears — A Climate Depot Flashback Report – Warming fears are the “worst scientific scandal in the history…When people come to know what the truth is, they will feel deceived by science and scientists.” – UN IPCC Japanese Scientist Dr. Kiminori Itoh, an award-winning PhD environmental physical chemist.

‘Some of the most formidable opponents of climate hysteria include politically liberal physics Nobel laureate, Ivar Giaever; Freeman Dyson; father of the Gaia Hypothesis, James Lovelock — ‘Left-center chemist, Fritz Vahrenholt, one of the fathers of the German environmental movement’

Flashback: Left-wing Env. Scientist Bails Out Of Global Warming Movement: Declares it a ‘corrupt social phenomenon…strictly an imaginary problem of the 1st World middleclass’

View Article here:

Nobel Prize-Winning Scientist Who Endorsed Obama Now Says Prez. is ‘Ridiculous’ & ‘Dead Wrong’ on ‘Global Warming’

Nothing can Compete with Water, Working with the Sun to Control the Earth’s Temperature

by Paullitely

The truth is that the normal water cycle moves more heat around exponentially than ANY greenhouse gas. Water evaporating at the surface absorbs vast amount of Solar energy. Water condensing into clouds at altitude releases vast amounts of that stored energy and radiates it into space. Cloud tops also reflect 90% of solar infrared heating radiation back into space. 97% of Greenhouse Gas is water vapor itself. CO2 is at most .03% of the atmosphere, and 3% of greenhouse gasses. NOTHING can compete with water, working with the Sun, to govern the Earth’s temperature. The Sun is the only major source of heat. Clouds are the only major heat re-Radiator. Man cannot possibly control the Sun Or Clouds, so Man cannot Control the Weather. ManMade CO2 Globalwarming is a theory that has been disproven clearly as Forecasted Warming has failed over the last 18 years. No amount of excuses will explain it, only changing the theory can explain it. So where are the new formulas and computer models? Show me and I May agree. See considerthisinfo.com for the full picture.

NOAA Releases New ADJUSTED Pause-Buster Global Surface Temperature Data and Immediately Claims Record-High Temps for May 2015 – UNBELIEVABLE!

Watts Up With That?

Guest Post by Bob Tisdale

NOAA recently published their State of the Climate Report for May 2015. Under the heading of Global Summary Information, they note:

Note: With this report and data release, the National Centers for Environmental Information is transitioning to improved versions of its global land (GHCN-M version 3.3.0) and ocean (ERSST version 4.0.0) datasets. Please note that anomalies and ranks reflect the historical record according to these updated versions. Historical months and years may differ from what was reported in previous reports. For more, please visit the associated FAQ and supplemental information.

But of course we know the adjustments that led to the new NOAA ERSST.v4 sea surface temperature data (the biggest changes to the NOAA data took place in the ocean portion) are not supported during the global warming slowdown period by the night marine air temperature dataset (HadNMAT2 from the UKMO) that…

View original post 488 more words

But The Ice Is Getting Thicker, Mr Shukman!

It is very revealing they the amount of time over freezing 0 degrees Centigrade is declining. It is also colder than average. So how does the ice melt under those conditions?

NOT A LOT OF PEOPLE KNOW THAT

By Paul Homewood

image

http://www.bbc.co.uk/news/science-environment-32553668

As part of their propaganda drive for Paris, the BBC’s “Science” Editor has taken a fossil fuel powered trip to the Arctic, to call in on a fossil fuel powered Norwegian scientific expedition, which is measuring and monitoring Arctic ice.

The expedition ship has been escorted into the ice pack by an icebreaker, the KV Svalbard, which will no doubt help to break up the ice a little bit more!

Shukman reports:

Changes in the Arctic Ocean are so profound that the region is entering what amounts to “a new era”, according to Norwegian scientists.

A switch from a permanent cover of thick ice to a new state where thinner ice vanishes in the summer will have far-reaching implications, they say.

The Norwegian Polar Institute has been mounting an expedition to the Arctic Ocean during the year’s coldest months.

Scientists have to brave extreme temperatures…

View original post 377 more words

Verifiable Details: “Comprehensive Analysis Reveals NOAA Wrongfully Applying ‘Master Algorithm’ To Whitewash Temperature History” – from Notrickzone.com and by Mike Brakey

Bombshell: Comprehensive Analysis Reveals NOAA Wrongfully Applying “Master Algorithm” To Whitewash Temperature History

A bit on the long side, but stunning to say the least. Energy physicist Mike Brakey tells us why he is not surprised the NOAA might be investigated by Congress. (Sticky post). 
=============================

The “Trick” to Controlling the Climate Agenda
By Mike Brakey

Brakey_1Last April, in a short, narrated YouTube series titled, Black Swan Climate Theory [1] (BSCT) irrefutable evidence was presented that sometime between 2011 and 2015 the National Oceanic and Atmospheric Administration (NOAA) had on two occasions rewritten its own version of Maine’s statewide climate history. The gist of my findings was that I believe I caught NOAA purposefully using computer code (algorithms [2]) to lower historic temperatures to promote present day temperatures as the warmest on record. The image above is from the new YouTube series posted after NOAA’s acknowledgement that they had indeed made improvements to Maine’s climate history.

On May 6, 2015, NOAA confirmed in writing that the 151°F of Fudging—the Massive Rewrite of Maine Climate History, [3 ] reported in Black Swan Climate Theory [4] (BSCT) study was no accident. NOAA states the changes were intentional and were justified! NOAA’s written statement included these words [5]:

…improvements in the dataset, and brings our value much more in line with what was observed at the time. The new method used stations in neighboring Canada to inform estimates for data-sparse areas within Maine (a great improvement).”

Brakey_2NOAA’s statement about the need to recently introduce colder Canadian data into Maine’s past climate history was highly fishy, to say the least. I decided to rework the research parameters to eliminate possible Canadian temperature infusion and confusion. Rather than compare my archived data for Lewiston/Auburn, Maine (Zone 19) to NOAA’s “statewide” [6] data for 32 Zones as I did in BSCT, I limited my analysis to NOAA’s southern interior data (CD 2) [7]. Since Lewiston/Auburn is centered in NOAA’s Maine southern interior climate region (see blue region of state chart), the two sets of numbers should essentially be identical. However, as I theorize, my findings again suggest NOAA is using a computer algorithm to inflate heating degree-days with all the raw climate data processed by an average of more than 10 percent.

This new approach is documented on our new narrated PowerPoint series, Black Swan Climate Theory II [8] (BSCTII). It will be posted on YouTube by early June 2015. Here are some of the highlights of our findings.

Incredible discrepancy

There remained an incredible discrepancy of Heating Degree Days (HDD) between the two southern interior Maine data sets.

Brakey_3

The green-shaded area of the above chart to the right represents NOAA’s HDD values for the southern interior region of Maine, which I downloaded in May 2015. The black bars represent the raw HDD data that I gathered for Lewiston/Auburn over the last 10 years. I observed negligible difference between NOAA’s data for southern interior Maine and for the entire state of Maine. The annual average HDD’s for 1895 to 2014 were:

* 7,565 based on the raw data for Lewiston/Auburn;
* 8,276 based on NOAA’s 2015 data for the entire state of Maine; and
* 8,381 based on NOAA’s 2015 data for the southern interior region of Maine (105 HDD colder than statewide! See NOAA table below).

Brakey_4

Flawed NOAA algorithms

I expected the HDD’s for the state’s entire 32 zones to be greater than for Lewiston/Auburn’s Zone 19 because the statewide NOAA data includes the vast colder regions in the northern part of the state. However, NOAA’s published 2015 data indicates the southern interior region of Maine runs 0.288°F colder on average over the last 119 years! This points out another of many flaws in the NOAA data when an agency begins relying on computer algorithms over basic clean data from Mother Nature.

As I lay out my case in BSCTII, I contend that NOAA adjusted the data for all of Maine and for the southern interior region using the same algorithm shown in the first chart. NOAA’s HDD adjustments were kept small in the most recent decade then grew substantially in earlier decades of the 19th and 20th centuries.

Brakey_5

The chart above is drawn from BSCTII, Part 3 of 6, YouTube presentation [9]. In the presentation, step-by-step, I compared the raw data for Lewiston/Auburn to NOAA’s data for the state of Maine. I was able to discern the two algorithms that I believe NOAA implemented in 2011 and in 2014. Mother Nature’s data is the solid black line in the chart. Deviations from Mother Nature is shown as the blue line (percentage adjustment detected in 2013 archived data); the red line shows the percentage adjustment made in 2014 (detected in 2015). The green line is the master algorithm, the net effect of the two adjustments (blue and red lines).

I speculate that NOAA intended to quietly rewrite climate history over two programming runs (2011 and 2014). Each would lower historical temperatures a total of approximately 130°F.

I speculate that computer programming errors were discovered internally by NOAA after the 2011 algorithm was launched. NOAA decreased the 1913 HDD by 10% as opposed to increasing it by that amount. NOAA made 1913 one of the hottest years in Maine’s history. They eventually corrected that error and others with their 2014 algorithm run. I was not the first to catch this major faux pas.

Joseph D’Aleo, did a paper in 2014, involving Farmington, Maine data in southern interior Zone 13. The title of his effort was “Data Set Changes Makes It Hard to Tell Real Story” [10]. He complained of a 5°F swing in 1913 for NOAA’s southern interior data. In my April study, I had detected a 4°F swing for 1913 based on statewide archived NOAA data.

Maine’s history made a total of 254°F cooler

The 2011 algorithm lowered Maine “statewide” temperatures around 103°F. The Phase II algorithm run in 2014 corrected the 1913 error and lowered overall temperatures an additional 151°F. I contend that the master algorithm is now fully operational and maintains that Maine’s statewide climate history is over 254°F lower than the original documented records between 1895 and 2014!

As detailed in BSCTII, I contend that NOAA has attempted to maintain a number of the climate “inflection points” for authenticity while minimizing or completely eliminating all but one cooling period between 1895 and 2014. Drawn from BSCTII, Part 5 of 6, YouTube presentation [11] the following chart shows originally three Black Swan events [12] found with the Lewiston-Auburn data (the black line) provided by Mother Nature.

Brakey_6

Three have been reduced to a single Black Swan event on the NOAA data (the green line) from 2014 for the southern interior region of Maine. Based on this and many other revelations found in BSCTII, I concluded that NOAA’s explanation of the inclusion of Canadian data was not only fishy—it proved to be a red herring [13].

“NOAA continues to manipulate historic climate data”

Based on these findings, my ongoing working theory is that NOAA continues to manipulate historic climate data through single master computer algorithm. The master algorithm array serves as the “trick” to hide present and future Black Swan [14] regional cooling events in Maine. I have also found that identical tweaks were being made with the other individual states and United State as a whole. It is being done by consistently lowering historical temperatures on all processed climate data controlled by NOAA as will be illustrated below with archived data from 2013.

Brakey_7

Algorithm applied nationwide…2014 a fabricated record

The graphs above illustrate how I contend NOAA applied a master algorithm “trick” not only to Maine, but to the United States as a whole. The green graphs show NOAA’s HDD published in 2013 for Maine and the U.S. The blue graphs show NOAA’s HDD published in 2015 for the same two locations. As you can see, the HDD have been inflated in both cases by the same percentages. In 2014, it appears NOAA had completed cooling both Maine and U.S. climate history by increasing HDD over 5%. This permitted NOAA to lower historical temperatures in excess of 10% between 1895 and 2014. Now NOAA and government agencies could announce to the world that 2014 was one of the warmest years in U.S. (revised) history.

Ohio adjusted as well

Another example includes NOAA’s data associated with Ohio. The green graph below shows NOAA’s data for Ohio prior to its 2014 adjustment (but after the 2011 adjustment).

Brakey_8

The blue shows the data after that adjustment. This second adjustment reduced Ohio’s historical temperatures by 83.8°F. You can see that it is the same pattern of adjustment as in Maine and the United States as a whole. I wonder if they needed Canadian meter stations here also!

NOAA’s data associated with Tennessee increased 18,802 HDD between 2013 and 2014. This reduced Tennessee’s historical temperature record an additional 51.5°F.

What is NOAA’s rational for the major correction here? The pattern is the same.
Based on my research to date, I have concluded that:

Whosoever holds the algorithm for interpreting and documenting past climate history possess the power to shape a nation’s perception of present climate and the funding solutions. Are we experiencing global warming or global cooling? It depends on whose historical climate data we are examining!

NOAA admitted to rewriting temperature

I want to emphasize again that NOAA admitted to massive rewrites of Maine “statewide” history on May 6, 2015. NOAA indicated all these changes to include Canadian stations were necessary to make sure the data truly reflected Maine history over the last 120 years.

How do they explain similar adjustments to Maine’s southern interior region, Tennessee, Ohio and the United States as a whole?

Every U.S. state for which I kept archived NOAA data had been corrupted in an identical manner. At this point in time, my theory that NOAA is rewriting U.S. climate history with a computer algorithm appears to still be valid.

Summary

I contend that the NOAA computer program essentially uses a very simple algorithm array, that automatically takes each historical year of local data and “shapes it” to fit into an overall mosaic NOAA wants to project to the scientific community and the general public.

Brakey_9

The table below lists “Year”, “NOAA Master Algorithm Adjustment”, and the “Anti-Master Algorithm”.

Brakey_15

The Anti-Master algorithm is nothing more than the reciprocal of NOAA’s algorithm.

This entire affair seems reminiscent of the early 1990s. The following chart below shows the multiple warming and cooling (Black Swan) periods over the last 1,100 years.

Brakey_10

In 1990, the United Nation’s Intergovernmental Panel on Climate Change (IPCC) published the graph seen in Chart 1. It showed that the Middle Ages were warmer than today, in what was called the “Medieval Warming Period”. Then, around the 14th century, society begins its descent into a series of “Black Swan” cooling climate events. We plunged into the “Little Ice Age” period from which we gradually emerged in the early 1700s. There were at least five major Black Swan events over this time period.

In the late 1990s Michael Mann published Chart 2 which redefined climate history and eliminated numerous Black Swan events. A Congressional investigation uncovered numerous errors in Mann’s chart and the IPCC dropped it from the Summary of Policymakers for its 2007 report. Unfortunately, the false hockey stick is still cited by advocates of the “science-is settled” position [15]. This includes powerful members of NOAA and the current U.S. administration.

Are we now remaking American climate history to adhere to Mann’s disappearing hockey stick? I have theorized that NOAA has possibly attempted a similar approach for inconvenient climate history in Maine and across the United States.

The following chart shows the result of applying NOAA’s algorithm to the Lewiston-Auburn, Maine data (the black line). The result is NOAA’s green line.

Brakey_11

In the transformation you eliminate two of the three Black Swans. This chart thereafter falls in line with Michael Mann’s chart from the late 1990’s that cited only one Black Swan event in the last hundred years.

My theory is that, if you begin with NOAA’s “adjusted” data and apply the anti-algorithm, you return the “processed data” back to how Mother Nature provided us the information in the first place.

USA likely in a state of cooling since 1990s

As a last example, on the chart below, we will take NOAA’s “processed” data for the United States climate history and apply the “anti-algorithm array” (see table above).

Brakey_12

The application of the anti-algorithm would indicate the United States, as a whole, might have been in a state of regional cooling since the late 1990s, as is presently true of Maine when you use Mother Nature’s original data.

“…certain individuals in NOAA have being hoisting a fraud on taxpayers”

If my theory is proven correct, it would mean certain individuals in NOAA have being hoisting a fraud on taxpayers of the U.S. and around the world. It has added up to trillions of dollars over the decade. [16]

As noted in BSCT and BSCTII, I play a short video clip of Doctor Feynman explaining how theories are generated and how they should be tested repeatedly.

Brakey_13

We expect no less here. I welcome a thorough examination of my algorithm theory.

In Black Swan Climate Theory II we explain, in depth, why, in my opinion, I believe this is not an accident. I have concluded American basic climate data has been hijacked and corrupted within NOAA through the use of a simple master computer algorithm that I have repeated here.

Brakey_14Profound implications

Based on the evidence from Maine, Ohio, Tennessee and consolidated U.S. climate data presented in the BSCT series; and should my theory be validated, the implications are profound. It would indicate we presently live in a nation where an agency of the Federal government has taken it upon themselves to rewrite the history of climate for the fifty different individual states of the Union.

If my theory proves correct, billions of dollars of climate data has been corrupted within a formerly great organization. Worse, decisions worth trillions of dollars are being made presently on fraudulent climate data. As well-intended as I believe most NOAA associates are, I implore NOAA to please make available the plain, unexciting, unfiltered temperature data provided by Mother Nature.

Throw the environmental activists [17] out! The litmus test for me is when NOAA’s climate data agrees with both satellite data and local archived data.

References:

[1] Black Swan Climate Theory, April, 2015, Mike Brakey, 1st series of five (5) short YouTube videos on NOAA climate adjustments https://www.youtube.com/playlist?list=PLDXMwo2SyaRse3GWujVHJGTLl9nvGAD59

[2] A computer program can be viewed as an elaborate algorithm. In mathematics and computer science, an algorithm usually means a small procedure that solves a recurrent problem. I contend NOAA has been attempting to correct a climate aberration that Mother Nature has repeatedly thrown at the organization since 1998. These inconvenient aberrations are pockets of regional cooling in Maine, across the United States and likely around the world between 1998 and 2010!

[3] 151 Degrees of Fudging, May 2, 2015, Mike Brakey, Link: http://notrickszone.com/2015/05/02/151-degrees-of-fudging-energy-physicist-unveils-noaas-massive-rewrite-of-maine-climate-history/#sthash.9QtBzze0.SF5o7vzD.dpbs

[4] Black Swan Climate Theory, April, 2015, Mike Brakey, series of five (5) short YouTube videos on recently discovered NOAA climate adjustments that rewrote Maine climate history – https://www.youtube.com/playlist?list=PLDXMwo2SyaRse3GWujVHJGTLl9nvGAD59

[5] NOAA E-Mail Confirms Large Scale Rewrite of U.S. Temperature Data, May 6, 2015, Mr. Derek Arndt, NOAA, Link: http://notrickszone.com/2015/05/07/noaa-e-mail-confirms-large-scale-rewrite-of-u-s-temperature-data-in-2014-improvements-in-the-dataset/#sthash.T6Bpcr1O.4fwNcmBn.dpbs

[6] NOAA classifies Maine heating degree days under four divisions. They are Statewide CD 1 North CD 2 South Interior, and CD 3 Coastal.

[7] Unlike “statewide” and “CD 1 North” this region, “CD 2 South Interior” should have no reason to be subject to Canadian temperature contamination.

[8] Black Swan Climate Theory II, Michael Brakey, June, 2015. The six part PowerPoint YouTube series is also found at the following link: https://www.youtube.com/playlist?list=PLDXMwo2SyaRse3GWujVHJGTLl9nvGAD59. The presentation takes you step-by-step through how it appears that leadership in NOAA unashamedly created a new master algorithm that was applied to the Maine data to rewrite climate history.

[9] See link: https://www.youtube.com/watch?v=Pn3QUEE3HYo&index=8&list=PLDXMwo2SyaRse3GWujVHJGTLl9nvGAD59

[10] https://redneckusa.files.wordpress.com/2014/07/data-set-changes-makes-it-hard-to-tell-real-story.pdf

[11] See Link: https://www.youtube.com/watch?v=go1zpvUzmRk&list=PLDXMwo2SyaRse3GWujVHJGTLl9nvGAD59&index=10

[12] A Black Swan event is a significant cooling period of more than ten years.

[13] red herring is something that misleads or distracts from a relevant or important issue. It may be either a logical fallacy or a literary device that leads readers or audiences towards a false conclusion.

[14] or theory of black swan events is a metaphor that describes an event that comes as a surprise, has a major effect, and is often inappropriately rationalized after the fact with the benefit of hindsight.

[15] The Deniers, Lawrence Solomon, 2008, Richard Vigilante Books, Chapter 2, The Case of the Disappearing Hockey Stick. pp. 9-21.

[16] The Alarming Cost Of Climate Change Hysteria, Larry Bell, Forbes, August, 2011; See link: http://www.forbes.com/sites/larrybell/2011/08/23/the-alarming-cost-of-climate-change-hysteria/

[17] Robber Barons disparaging term dating back to the 12th century which refers to: 1. Unscrupulous feudal lords who amassed personal fortunes by using illegal and immoral business practices. 2. In social criticism and economic literature, became a derogatory term applied to some wealthy and powerful 19th-century American businessmen. Does it now apply to the leaders of the environmental movement?

– See more at: http://notrickszone.com/2015/06/01/bombshell-comprehensive-analysis-reveals-noaa-wrongfully-applying-master-algorithm-to-whitewash-temperature-history/#sthash.SDLGM9LB.cj6bSx0i.dpuf

Forecasting Climate Change Is A Very Complex Process – Something has gone terribly Wrong with Global Warming Models

Watts Up With That?

Guest essay by Howard Lowe

models-vs-datasets Models have difficulty predicting the current temperature, let alone the future. Source: WSJ

Mother Earth is a dynamic place, constantly changing and evolving. Although it operates in a cyclical manner, the major cycles are not short, falling into a time frame of thousands, tens of thousands, and hundreds of thousands of years. We know that the Sun rises in the east and sets in the west on a regular 24-hour cycle, but times vary depending on the season of the year. The Earth revolves around the Sun, and the Moon around the Earth, all in a cyclical predictable manner. These phenomena have always intrigued man leading him to seek more knowledge about his surroundings, about the star-filled skies, about his origin, about the future.

For more than a hundred thousand years man has developed into a sophisticated creature, one with ever increasing scientific ‘know how’…

View original post 1,806 more words

All UNADJUSTED Global Temperature Series Show Cooling Since Year 2000. Published Adjustments ARE The Warming

Global Temperatures RAW DATA all Authority Sources

Look at the RAW TEMPERATURE DATA USED BY ALL GLOBAL TEMPERATURE AUTHORITIES BEFORE ADJUSTMENTS.  They ALL decline since the year 2001.  Any warming they publish is from ADJUSTMENTS they have made to the data. Note: HADCRUT4 “Raw Data” was actually recycled HADCRUT3 Adjusted Data

See tables of the data for yourself, courtesy of woodfortrees.org

http://www.woodfortrees.org/plot/hadcrut4gl/from:1987/to:2016/plot/hadcrut4gl/from:2002/to:2016/trend/plot/hadcrut3gl/from:1987/to:2016/plot/hadcrut3gl/from:2002/to:2016/trend/plot/rss/from:1987/to:2016/plot/rss/from:2002/to:2016/trend/plot/hadsst2gl/from:1987/to:2016/plot/hadsst2gl/from:2002/to:2016/trend/plot/hadcrut4gl/from:1987/to:2002/trend/plot/hadcrut3gl/from:1987/to:2002/trend/plot/hadsst2gl/from:1987/to:2002/trend/plot/rss/from:1987/to:2002/trend/plot/esrl-amo/from:2002/to:2016/trend
There are NO Warming trends unless adjustments are the reason.

The Big Global Climate Temperature Data Lie Becomes Official At NOAA

The Big Lie Becomes Official At NOAA

I’ve been warning for months that NOAA was going to claim that 2012 was the hottest year ever, regardless of the actual temperatures. They did it today.

The year 2012 was the warmest on record for the contiguous United States, beating the previous record by a full degree in temperature, a government climate agency said on Tuesday.  Scientists at the National Oceanic and Atmospheric Administration said the average temperature in 2012 in the contiguous United States was 55.3 degrees Fahrenheit (12.94 degrees Celsius), 3.2 degrees above the average recorded during the 20th century and 1.0 degree above 1998, until now the hottest on record.

2012 was hottest year on record in U.S., climate agency says | Reuters

I will do a more complete analysis later, but for now I want you to focus on the bold sentence above, which claims that 1998 used to be the hottest year in the US.

In an article which NASA published in 1999, Hansen showed that 1998 was only the fifth warmest year, after 1934, 1921, 1931 and 1953. In fact, 1998 was 0.6C cooler than 1934.

Science Briefs


Whither U.S. Climate?


By James Hansen, Reto Ruedy, Jay Glascoe and Makiko Sato — August 1999


ScreenHunter_385 Jan. 08 16.20

NASA GISS: Science Briefs: Whither U.S. Climate?

Over the past decade, NASA and NOAA have continuously altered the temperature record to cool the past and warm the present. Their claims are straight out of Orwell’s 1984, and have nothing to do with science.

US NCDC – National Climate Data Center Spikes Recent Temperature Data from 1949 Upwards 4 Degrees Artificially to Make Claims of Global Warming.

It’s all being done “for our own good”. We must believe in using less fossil fuels. We must believe in giving more Billions to the UN for more studies even though that “Science is Settled”. We must be accept higher costs for food and energy so we will consume less and produce less waste. What about those who literally die because they can’t afford it? What about the hypocrisy of saying “Trust Us?  There are Respected Scientists watching and saying LOOK AT THE FACTS, do the warnings follow the facts?

US National Climate Data Center Blows Away All Records For Data Tampering

Despite record cold and Great Lakes ice, NCDC thinks they can get away altering the US temperature record to make the past winter just below average temperature.

ScreenHunter_546 Mar. 13 16.28

Climate at a Glance | Time Series

74% of the US was below normal temperature this winter, much of it 10 degrees below normal.

Last3mTDeptUS

Last3mTDeptUS.png (688×531)

It was actually the ninth coldest winter on record, and the coldest in 35 years.

ScreenHunter_547 Mar. 13 16.38

NCDC bumped the winter up to 34th warmest, through an amazing 4 degrees of tampering relative to 1949.

ScreenHunter_545 Mar. 13 16.25

These adjustments are about 5 times larger than what they show in USHCN documents.

[Anthony Watts pointed out that the HPRCC map above uses a different set of stations and different baseline period than the NCDC graph. This is a valid point and affects the 74% of US below normal I mentioned, but seems unlikely to account for more than a about half a degree difference in the regional anomalies.]